Parse and Analyze Excel Spreadsheets with LlamaParse
In this example, learn how to use LlamaParse to parse Excel spreadsheets, and (optionally) use that as the basis for a RAG app that can answer questions about the data within the table.
For this example, we'll be using a simple DCF template, which you can download here. Once you do, rename the file to dcf_template.xlsx.
At the end of this example, we will create a mini RAG app with LlamaIndex framework that can answer questions, using OpenAI. You can skip this part, or use another model provider
Setup & Connect to LlamaCloud
To get started, we'll install llama-cloud-services and (optionally) llama-index:
!pip install llama-index
!pip install llama-cloud-services
import os
from getpass import getpass

os.environ["LLAMA_CLOUD_API_KEY"] = getpass("Llama Cloud API Key: ")
os.environ["OPENAI_API_KEY"] = getpass("OpenAI API Key: ")
Once you have your API keys, you can initialize LlamaParse:
from llama_cloud_services import LlamaParse

parser = LlamaParse(
    parse_mode="parse_page_with_agent",
    model="openai-gpt-4o-mini",
    high_res_ocr=True,
    adaptive_long_table=True,
    outlined_table_extraction=True,
    output_tables_as_HTML=True,
)
Parse the Spreadsheet
Once you have LlamaParse set up, you can parse the example spreadsheet, which should result in the following output:
result = await parser.aparse("dcf_template.xlsx")
llama_parse_documents = result.get_text_documents(split_by_page=True)

print(llama_parse_documents[1].text)
Discounted Cash Flow Excel Template
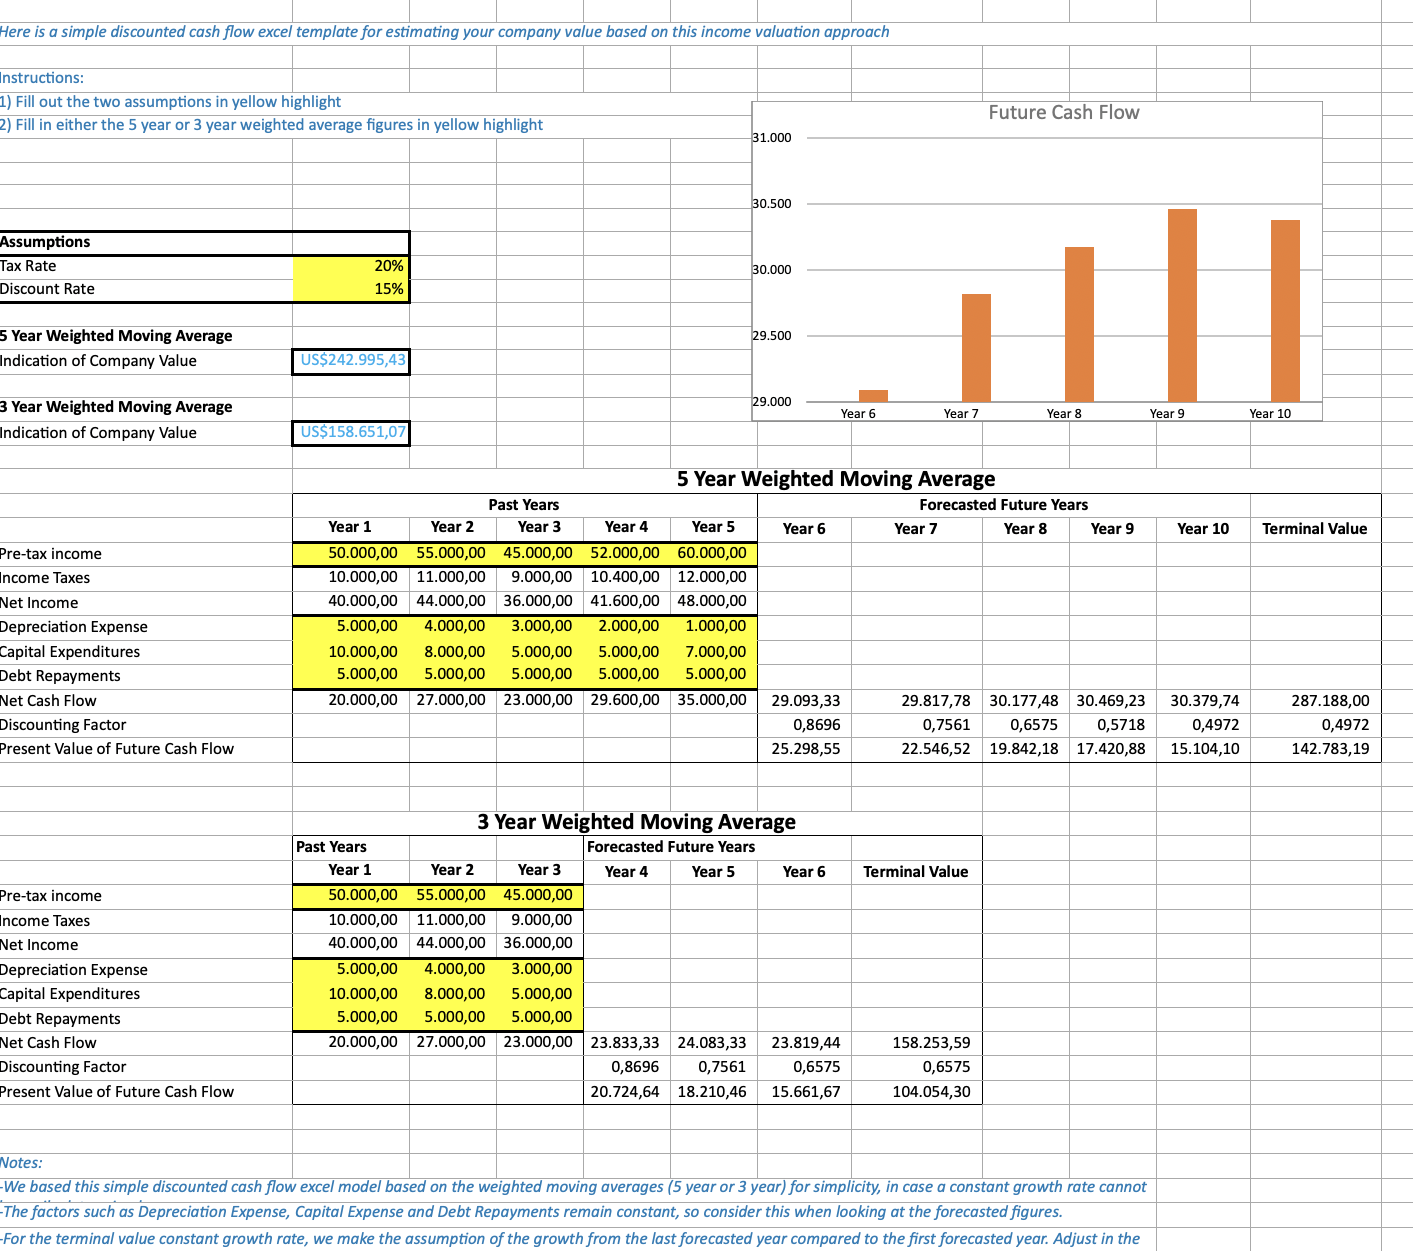
Here is a simple discounted cash flow excel template for estimating your company value based on this income valuation approach
Instructions:
1) Fill out the two assumptions in yellow highlight
2) Fill in either the 5 year or 3 year weighted average figures in yellow highlight
Assumptions
Tax Rate 20%
Discount Rate 15%
5 Year Weighted Moving Average
Indication of Company Value $242,995.43
3 Year Weighted Moving Average
Indication of Company Value $158,651.07
5 Year Weighted Moving Average
Past Years Forecasted Future Years
Year 1 Year 2 Year 3 Year 4 Year 5 Year 6 Year 7 Year 8 Year 9 Year 10 Terminal Value
Pre-tax income 50,000.00 55,000.00 45,000.00 52,000.00 60,000.00
Income Taxes 10,000.00 11,000.00 9,000.00 10,400.00 12,000.00
Net Income 40,000.00 44,000.00 36,000.00 41,600.00 48,000.00
Depreciation Expense 5,000.00 4,000.00 3,000.00 2,000.00 1,000.00
Capital Expenditures 10,000.00 8,000.00 5,000.00 5,000.00 7,000.00
Debt Repayments 5,000.00 5,000.00 5,000.00 5,000.00 5,000.00
Net Cash Flow 20,000.00 27,000.00 23,000.00 29,600.00 35,000.00 29,093.33 29,817.78 30,177.48 30,469.23 30,379.74 287,188.00
Discounting Factor 0.8696 0.7561 0.6575 0.5718 0.4972 0.4972
Present Value of Future Cash Flow 25,298.55 22,546.52 19,842.18 17,420.88 15,104.10 142,783.19
3 Year Weighted Moving Average
Past Years Forecasted Future Years
Year 1 Year 2 Year 3 Year 4 Year 5 Year 6 Terminal Value
Pre-tax income 50,000.00 55,000.00 45,000.00
Income Taxes 10,000.00 11,000.00 9,000.00
Net Income 40,000.00 44,000.00 36,000.00
Depreciation Expense 5,000.00 4,000.00 3,000.00
Capital Expenditures 10,000.00 8,000.00 5,000.00
Debt Repayments 5,000.00 5,000.00 5,000.00
Net Cash Flow 20,000.00 27,000.00 23,000.00 23,833.33 24,083.33 23,819.44 158,253.59
Discounting Factor 0.8696 0.7561 0.6575 0.6575
Present Value of Future Cash Flow 20,724.64 18,210.46 15,661.67 104,054.30
Notes:
-We based this simple discounted cash flow excel model based on the weighted moving averages (5 year or 3 year) for simplicity, in case a constant growth rate cannot be easily determined.
-The factors such as Depreciation Expense, Capital Expense and Debt Repayments remain constant, so consider this when looking at the forecasted figures.
-For the terminal value constant growth rate, we make the assumption of the growth from the last forecasted year compared to the first forecasted year. Adjust in the formula as needed.
(Optional) Ask Questions Over the Data
Now, you can create a system that is able to answer questions based on the context provided by the parsed excel spreadsheet. For this step, we'll be using LlamaIndex. We start by configuring an LLM. In this case, we are using gpt-5:
from llama_index.llms.openai import OpenAI

llm = OpenAI(model="gpt-5-mini")
The easiest way to do this is to augment a prompt with the contents of the parsed spreadsheet:
from llama_index.core.llms import ChatMessage

query_str = "Tell me about the income taxes in the past years (year 3-5) for the 5 year WMA table"
context = "\n\n".join([doc.text for doc in llama_parse_documents])
messages = [
    ChatMessage(
        role="user",
        content=f"Here is some context\n<context>{context}</context>\n\nAnswer the following question: {query_str}",
    )
]

response = await llm.achat(messages)
print(response.message.content)
In the 5‑year WMA table the income tax amounts for past years 3–5 are:
- Year 3: $9,000.00
- Year 4: $10,400.00
- Year 5: $12,000.00

These equal 20% of the respective pre‑tax incomes (45,000; 52,000; 60,000), consistent with the 20% tax rate assumption. The taxes rise each year as pre‑tax income increases.